Events
Events are simple object to use and are aimed to facilitate illustration of epochs in any time of data.
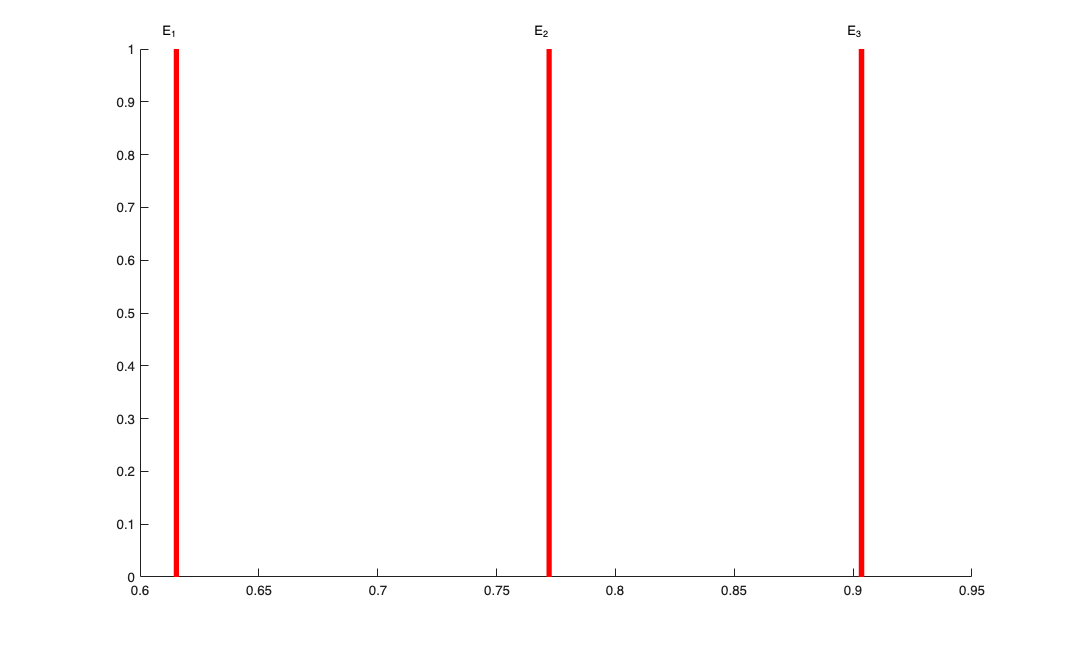
close all;
eTimes = sort(rand(1,3)*1);
eLabels={'E_1','E_2','E_3'};
eventColor = 'b';
e=Events(eTimes,eLabels,eventColor);
e.plot;

The color of the event markers can also be specified
figure; e.plot([],'r'); %dont specify handle, use red; handel = gca;
figure; e.plot([],'g'); %dont specify handle, use green;