Examples
These examples are runnable end to end and require no acquisition hardware. They mirror the scripts in the examples/ folder of the repository, so you can copy-paste from here or run the scripts directly.
If you use Thalamus in your work, please cite our paper: Thalamus: a real-time, closed-loop platform for synchronized multimodal data acquisition (Communications Engineering, Nature).
Note
The example scripts live in the examples/
folder of the repository (they are not shipped in the installed wheel). Run them
from the repo root. The first walkthrough below is the recommended starting point;
later sections build on the same .tha workflow.
Synthesize and analyze a recording without hardware
A Thalamus recording (a .tha capture file) is simply a sequence of
length-prefixed protobuf StorageRecord messages: a leading metadata
record followed by analog (or image, text, …) records. Because the
format is open, you can produce a perfectly valid recording programmatically and
then exercise the full analysis toolchain against it.
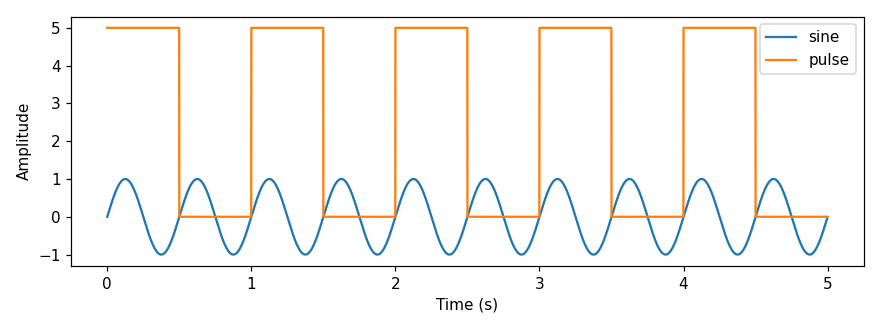
This example generates a 5-second recording with two channels – a 2 Hz sine wave and a 1 Hz square pulse – and then reads, exports, hydrates, and plots it.
1. Generate a capture file
The following script writes a file that is indistinguishable from one produced by
a STORAGE2 node. Each analog record carries 16 ms of data; channels are
concatenated in data and a Span maps each slice to a named channel.
import math, datetime, pathlib
from thalamus.thalamus_pb2 import StorageRecord, AnalogResponse, Span, Metadata, Pair
from thalamus.record_writer import write_record

SAMPLE_RATE, POLL_MS, DURATION_S = 1000, 16, 5
INTERVAL_NS = int(1e9 / SAMPLE_RATE)
SAMPLES_PER_POLL = SAMPLE_RATE * POLL_MS // 1000
total = SAMPLE_RATE * DURATION_S

out = pathlib.Path(f"synthetic.tha.{datetime.date.today():%Y%m%d}.1")
with out.open("wb") as stream:
    write_record(stream, StorageRecord(
        node="storage", time=0,
        metadata=Metadata(keyvalues=[Pair(key="Rec", integral=1)])))
    produced, t_ns = 0, 0
    while produced < total:
        count = min(SAMPLES_PER_POLL, total - produced)
        sine, pulse = [], []
        for i in range(count):
            t = (produced + i) / SAMPLE_RATE
            sine.append(math.sin(2 * math.pi * 2.0 * t))
            pulse.append(5.0 if int(t * 2) % 2 == 0 else 0.0)
        produced += count
        t_ns += count * INTERVAL_NS
        write_record(stream, StorageRecord(
            node="wave", time=t_ns,
            analog=AnalogResponse(
                data=sine + pulse,
                spans=[Span(begin=0, end=count, name="sine"),
                       Span(begin=count, end=2 * count, name="pulse")],
                sample_intervals=[INTERVAL_NS, INTERVAL_NS], time=t_ns)))
print("wrote", out)
The full script is available as examples/synthetic_recording.py:
python examples/synthetic_recording.py -o demo.tha
2. Inspect the records
You can iterate over the records directly with thalamus.record_reader2:
python -m thalamus.record_reader2 demo.tha
3. Export to CSV or Parquet
The thalamus.dataframe module turns a node’s channels into a tabular file:
python -m thalamus.dataframe -n wave -i demo.tha -f csv -o demo.csv
The output is indexed by counter (the sample timestamp in nanoseconds) with one
column per channel:
counter,sine,pulse
1000000,0.0,5.0
2000000,0.012566039883352607,5.0
...
4. Hydrate to HDF5
To produce a single self-describing HDF5 file for downstream analysis, hydrate the capture:
python -m thalamus.hydrate demo.tha
This writes demo.tha.h5 containing, for each channel, a data dataset of
samples and a received dataset of timing information (see Quick Start
for the layout).
5. Plot the channels
The examples/analyze_recording.py script reconstructs the per-channel time
series straight from the .tha file and saves a plot:
python examples/analyze_recording.py demo.tha -n wave -o analysis.png
From here you can apply any analysis you like (NumPy, SciPy, pandas, MATLAB). For worked analyses on real recordings – including the figures from our paper – see the SimpleUseCase folder.
Close a loop
Thalamus’s defining capability is real-time closed-loop control: a value is
measured, a rule decides on an action, and that action feeds back and changes the
value. In a live pipeline you wire it as sensor → ALGEBRA/TOGGLE (decide) →
output (see the pipeline diagram in Concepts and Architecture), with the output driving
hardware that affects the sensor.
examples/closed_loop_demo.py simulates exactly that loop in software so you can
run and inspect it without hardware: a process variable drifts up, a hysteresis
(bang-bang) controller switches a control output on above an upper threshold and
off below a lower one, and the control output pulls the process variable back down –
closing the loop.
python examples/closed_loop_demo.py -o loop.tha
python examples/analyze_recording.py loop.tha -n loop -o loop.png
Controller switched 4 times; the loop held the process variable in [0.00, 1.00]
around the [0.0, 1.0] band.
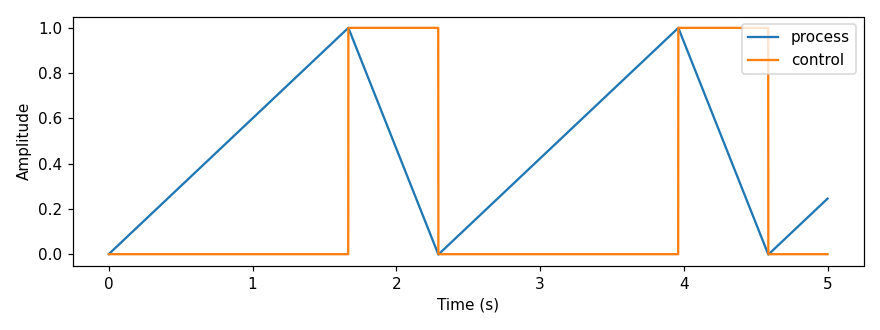
The process and control channels are recorded together, so the loop is fully
reconstructable from the capture. To measure the latency of a loop (the delay
between a trigger and its response), see Measure closed-loop latency below.
Record event markers (text)
Experiments often interleave a continuous signal with discrete event markers
such as trial_start or reward. Thalamus stores these as text records on
the same timeline as the analog data. examples/event_markers.py writes a
recording with five markers on an events node plus a continuous reward
analog channel on a daq node:
python examples/event_markers.py -o events.tha
Export the markers to a table with the text data type:
python -m thalamus.dataframe -n events -t text -i events.tha -f csv
counter,text
200000000,trial_start
400000000,cue_on
600000000,cue_off
800000000,reward
1000000000,trial_end
Record a synthetic video stream (images)
Camera data is stored as image records, each carrying the raw frame bytes plus
width, height, pixel format, and frame interval. examples/synthetic_video.py
writes a short Gray clip (no camera required) and extracts one frame to a PNG so
you can see how to decode image records:
python examples/synthetic_video.py -o video.tha --frame 15 --png frame.png
The key decode step is reshaping the raw bytes into a 2-D array:
import numpy
from thalamus.record_reader2 import SimpleRecordReader

with SimpleRecordReader("video.tha") as reader:
    frames = [r for r in reader if r.WhichOneof("body") == "image"]
image = frames[15].image
arr = numpy.frombuffer(image.data[0], dtype=numpy.uint8).reshape(image.height, image.width)
Record several nodes at once
A real session records many nodes into one file – each tagged with its node name.
examples/multinode_recording.py writes an eye node (channels x and y)
and an emg node (channel ch0):
python examples/multinode_recording.py -o session.tha
Export each node independently by name:
python -m thalamus.dataframe -n eye -i session.tha -f csv -o eye.csv
python -m thalamus.dataframe -n emg -i session.tha -f csv -o emg.csv
Summarize any capture file
When you receive an unfamiliar recording, examples/capture_summary.py reports
its nodes, data types, analog channels, duration, and metadata:
python examples/capture_summary.py session.tha
File: session.tha
Records: 627  {'metadata': 1, 'analog': 626}
Duration: 4.984 s
Metadata: [('Rec', 1)]
Nodes:
  emg: {'analog': 313}  channels=['ch0']
  eye: {'analog': 313}  channels=['x', 'y']
  storage: {'metadata': 1}
Measure closed-loop latency
Quantifying the latency of a closed loop – a trigger fires and a downstream system
responds some milliseconds later – is a core Thalamus use case.
examples/closed_loop_latency.py synthesizes a recording with a trigger and a
response channel offset by a known delay, then recovers that delay by detecting
and pairing rising edges (the same analysis behind the closed-loop performance
figures in the paper):
python examples/closed_loop_latency.py
Synthesized .../loop.tha (response lags trigger by 5 ms)
trigger edges: 5, response edges: 5
latency (ms): mean=5.000 std=0.000 min=5.000 max=5.000
Pass a path to analyze your own recording instead:
python examples/closed_loop_latency.py recording.tha -n daq --trigger trigger --response response
Record a uint64 (ulong) counter channel
Analog streams can carry 64-bit unsigned integers (ulong_data /
is_ulong_data) for counters, hardware timestamps, or event tallies.
examples/ulong_counter.py writes a .tha whose counter node emits a uint64
sample counter, then it can be read back and exported like any other channel:
python examples/ulong_counter.py -o counter.tha
python -m thalamus.dataframe -n counter -i counter.tha -f csv -o counter.csv
counter,samples
1000000,0
2000000,1
...
Both thalamus.record_reader2 and thalamus.dataframe read the ulong path
(record.analog.is_ulong_data is True and the values live in
record.analog.ulong_data).
Write a behavioral task
examples/hello_world_task.py is the smallest useful Task Controller task: it draws a square, waits for a touch (or a 5 second
timeout), logs the trial, and returns success/failure. It is loaded by the Task
Controller rather than run standalone:
python -m thalamus.task_controller --ext examples/hello_world_task.py
It demonstrates the task API: create_widget for the control UI, an async
run(context) returning a TaskResult, drawing via context.widget.renderer,
input via context.widget.touch_listener, timing with context.any /
context.until / context.sleep, and context.log for trial events. See the
Task Controller guide for the full API.